Definition

Higher order problems on displacement-time graphs

Example:
Consider the given plot of displacement varying sinusoidally with time. Find its average velocity in
Solution:
Average velocity is defined as ratio of net displacement and total time.
Displacement,
Average velocity
Consider the given plot of displacement varying sinusoidally with time. Find its average velocity in
Solution:
Average velocity is defined as ratio of net displacement and total time.
Displacement,
Average velocity
Result
Average velocity from velocity-time graph
Instantaneous velocity at a given time-instant for a particle can be found from the y-intercept of its velocity-time graph.
From a particle's velocity-time graph, its average velocity can be found by calculating the total area under the graph and then dividing it by the corresponding time-interval.
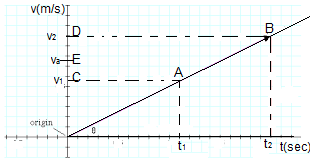
For a particle with uniform acceleration, velocity-time graph is a straight line. Its average velocity is given by . From the graph, this can be found by drawing the y-intercepts of initial and final velocities and then drawing the mid-point.
In the given graph, instantaneous velocity at and at .
Average velocity is found at E, i.e. mid-point of C and D.
From a particle's velocity-time graph, its average velocity can be found by calculating the total area under the graph and then dividing it by the corresponding time-interval.
For a particle with uniform acceleration, velocity-time graph is a straight line. Its average velocity is given by . From the graph, this can be found by drawing the y-intercepts of initial and final velocities and then drawing the mid-point.
In the given graph, instantaneous velocity at and at .
Average velocity is found at E, i.e. mid-point of C and D.
Result
Acceleration from velocity-time graph

Acceleration of a particle is equal to the slope of a velocity-time graph.
In the given graph,
Acceleration may be positive, negative or zero as it is a vector quantity.
In the given graph,
Acceleration may be positive, negative or zero as it is a vector quantity.
Result
Displacement from velocity-time graph

Displacement of a particle in a given time-interval is equal to the total area under the velocity-time graph in the given time-interval.
In the given graph, displacement is found as area of trapezium ABCD.
Note: Since, displacement is a vector quantity, Area below the time-axis is considered as negative and above it is considered as positive.
In the given graph, displacement is found as area of trapezium ABCD.
Note: Since, displacement is a vector quantity, Area below the time-axis is considered as negative and above it is considered as positive.
Definition
Velocity-time graph
The Velocity Time Graph: Velocity-time graph is a plot between Velocity and Time. It shows the Motion of the object that moves in a Straight Line. Magnitude of Velocity at a given instant is equal to its Instantaneous Speed. It is drawn for 1-D motion only and can take both positive and negative values.
In case where the acceleration is zero, the slope is zero ( horizontal line). If the acceleration is positive, then the slope is positive (an upward sloping line).
In case where the acceleration is zero, the slope is zero ( horizontal line). If the acceleration is positive, then the slope is positive (an upward sloping line).
Diagram
Velocity Time graph for rest, uniform motion and uniform acceleration

.
Definition
Area under acceleration time graph

Change in velocity of a particle can be evaluated as area under the acceleration-time graph.
as
or
or (Which is area under the curve.)
as
or
or (Which is area under the curve.)
Definition
Velocity time graph for motion described piece-wise

Example:
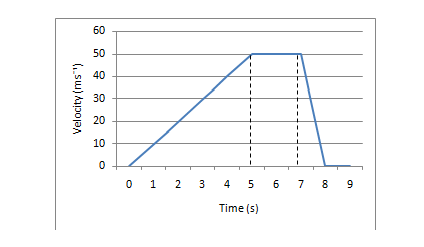
Find the total displacement for the given graph in .
Solution:
For , displacement is given by
For , displacement is given by
Total displacement,
Find the total displacement for the given graph in .
Solution:
For , displacement is given by
For , displacement is given by
Total displacement,
Definition
Interpretation of acceleration-time graph

Acceleration vs. time graphs tell us about an object's velocity in the same way that velocity vs. time graphs tell us about an object's displacement. The change in velocity in a given time interval is equal to the area under the graph during that same time interval.
Definition
Acceleration Vs Time Graph for piece-wise execution of motion

Acceleration-time graph for a particle describing motion piece-wise for separate time intervals.
 |
| BookMarks |
Page 11 Page 12 Page 13 Page 14
0 Comments
Post a Comment